What is the Glycemic Index?
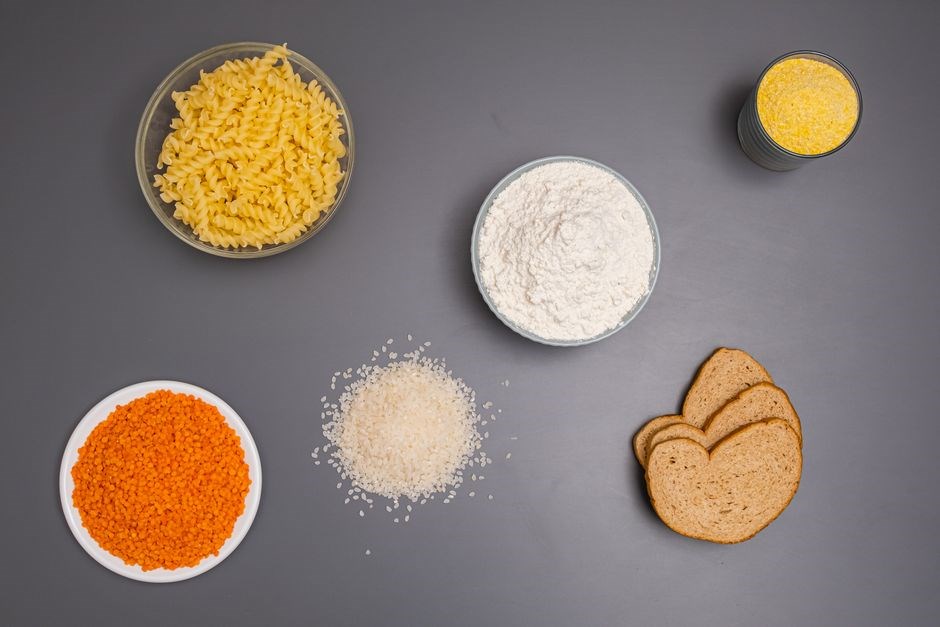
The glycemic index (GI) ranks foods by their blood‑sugar impact. A complete PDF table lists GI values, serving sizes, and reference foods, enabling nutritionists and patients to compare carbohydrate quality and plan balanced meals. It is a practical tool for diabetes care. It aids glucose control
Definition and Measurement
The glycemic index (GI) is a standardized numerical scale that ranks carbohydrate‑containing foods by their effect on post‑prandial blood glucose. In a typical test, healthy volunteers consume a fixed amount of carbohydrate—usually 50 g of glucose or the carbohydrate content of a reference portion of the test food—while fasting. Blood glucose is measured at baseline and at regular intervals over a two‑hour period. The incremental area under the curve (iAUC) for the test food is calculated and expressed as a percentage of the iAUC for the reference. A GI of 70 or higher is considered high, 56–69 medium, and 55 or lower low. The methodology, pioneered by Dr. David Jenkins in the 1970s, has been refined to account for fiber, fat, protein, and processing. In a comprehensive PDF table, each entry lists the food name, portion size, carbohydrate grams, GI value, and often the standard deviation and source reference. The table may also include a glycemic load column, which multiplies the GI by the carbohydrate content per serving and divides by 100. The PDF format facilitates easy sharing, printing, and integration into dietary plans, and many health agencies provide downloadable versions that are regularly updated with new research. When interpreting the table, it is important to remember that individual responses can vary; factors such as gut microbiota, meal composition, and timing can shift the actual glycemic response. Nonetheless, the GI remains a valuable tool for clinicians and consumers to assess carbohydrate quality and design meals that promote stable glucose levels. It lists cooking timeand ripeness.
Historical Development of GI
In the early 1970s, Dr. David J. Jenkins and colleagues at the University of Toronto began systematic studies of carbohydrate quality. They devised a method to quantify the post‑prandial glucose response to foods, leading to the first published glycemic index (GI) values in 1978. The concept was initially met with skepticism, as the prevailing focus was on total carbohydrate intake rather than quality. Over the 1980s, the GI gained traction through research linking high‑GI diets to increased risk of type 2 diabetes, cardiovascular disease, and obesity. The 1990s saw the publication of comprehensive GI tables, including the seminal “Glycemic Index of Foods” by Jenkins et al., which served as a reference for nutritionists worldwide. By the early 2000s, the GI had become a staple in dietary guidelines, prompting the development of the glycemic load (GL) metric to account for portion size. Recent advances incorporate the role of fiber, fat, protein, and food processing, refining GI values for whole grains, legumes, and refined products. Today, numerous organizations—such as the American Diabetes Association and the UK’s National Health Service—provide downloadable PDF tables that are continuously updated with new research, ensuring clinicians and consumers have access to the most current carbohydrate quality data. Researchers now also examine how gut microbiota modulate glycemic responses, revealing that personalized diets may outperform generic GI recommendations for all kids;

Structure of a Complete Glycemic Index Table PDF
A PDF table lists foods, GI scores, serving sizes, reference values, and notes on fiber or processing. It includes a legend, column headers, and footnotes for methodology, enabling quick carbohydrate quality assessment. It lists carbs per serv
Typical Sections Included
The complete glycemic index PDF is organized into distinct, logically arranged sections that facilitate quick reference and in‑depth study; First, a concise front page presents the title, publication date, and author credentials, establishing credibility. Next, a table of contents lists all major headings and sub‑headings with page numbers, allowing readers to jump directly to areas of interest. The introductory chapter explains the purpose of the index, the scientific basis for GI measurement, and the scope of the food list, clarifying any limitations or assumptions. A dedicated methodology section details the experimental design, reference carbohydrate amounts, test conditions, and statistical analysis, ensuring transparency and reproducibility. The core of the document is the food table itself, arranged alphabetically or by food group, and containing columns for food name, GI value, serving size, reference food, and notes on fiber or processing that can influence glycemic response. Below the table, a series of explanatory notes interpret key columns, provide conversion factors, and highlight common pitfalls. A footnote section cites all primary research sources, enabling readers to verify data or explore further; Finally, the PDF concludes with appendices that may include a glossary of terms, a list of recommended reading, and contact information for the publishing organization. A disclaimer clarifies that the index is not a substitute for professional medical advice.
Formatting and Accessibility Features
In a professional glycemic‑index PDF, layout is engineered for clarity and universal use. The document begins with a clean cover page that lists the title, edition, and author credentials, followed by a hyperlinked table of contents that allows instant navigation to any section; The main table is presented in a fixed‑width grid, each column labeled with bold, sans‑serif headings and a subtle background shade to separate header rows from data rows. Font size is set to 10‑pt for body text and 12‑pt for headings, ensuring legibility on both screen and print. Rows alternate in light gray to aid visual tracking, and each food entry is accompanied by a small icon indicating whether the item is whole, processed, or fortified. The PDF is tagged for assistive technology; each table cell is marked as a data cell, and row/column headers are explicitly defined so screen readers can announce context. Alt‑text descriptions accompany images and icons, and the file includes a language declaration (en‑US) so that screen readers use the correct pronunciation. Hyperlinks in the table of contents and in footnotes open to the corresponding page or external reference, and the PDF’s metadata contains author, subject, and keywords for search engines. The file is compressed to under 2 MB without loss of quality, and a checksum is provided for integrity verification. Finally the document is exported in PDF‑/UA‑1 format, ISO standard for accessible PDFs, guaranteeing compatibility with screen reading software and compliance with ADA guidelines.

Health Benefits of Using a GI Table
A complete GI PDF empowers dietitians to tailor meals, reducing post‑meal glucose spikes and aiding diabetes control. It supports weight management by highlighting low‑GI foods that curb hunger, and it simplifies nutrition education for patients seeking diets.!
Managing Diabetes and Blood Sugar Levels
For individuals with type 1 or type 2 diabetes, a comprehensive glycemic‑index PDF offers a structured approach to carbohydrate selection. By referencing the GI values listed for each food, clinicians can prescribe meals that maintain post‑prandial glucose within target ranges, thereby reducing the need for insulin adjustments. The table also displays portion sizes, allowing precise calculation of carbohydrate units per serving. This precision supports basal‑bolus insulin regimens, where carbohydrate counting is critical. Moreover, the PDF’s color‑coded categories (low, medium, high) help patients quickly identify foods that produce minimal glucose excursions. When combined with continuous glucose monitoring data, the GI table becomes a dynamic tool: patients can compare predicted glycemic responses with real‑time sensor readings, refine their dietary choices, and observe the impact of meal timing. The result is improved glycemic variability, fewer hypoglycemic events, and better overall metabolic control. Additionally, the PDF can be integrated into electronic health records, enabling care teams to track dietary adherence and adjust prescriptions in real time. This synergy between evidence‑based GI data and personalized care contributes to long‑term diabetes management success. Clinicians also use the PDF to educate patients on the impact of fiber, protein and healthy fats, which can blunt post‑prandial spikes and promote sustained satiety, thereby enhancing adherence to dietary plans daily. weekly.??!
Weight Management and Appetite Control
When the glycemic‑index PDF is used as a reference for meal planning, it empowers people seeking weight loss or maintenance to make choices that stabilize blood sugar and curb hunger. Foods with a low GI release glucose slowly, keeping insulin levels steady and preventing the rapid post‑meal drop that often triggers cravings. By contrast, high‑GI foods cause quick spikes followed by sharp declines, which can lead to overeating. The table’s clear labeling of carbohydrate content per serving allows users to calculate exact grams of digestible carbs, supporting portion control. Combining low‑GI staples such as legumes, whole grains, and non‑starchy vegetables with protein or healthy fats further prolongs satiety, as the slower digestion delays gastric emptying. Research cited in nutrition journals shows that diets emphasizing low‑GI foods are associated with reduced body mass index and improved waist circumference over 12‑month periods. Additionally, the PDF’s visual cues—color coding and numeric ranges—help individuals quickly identify foods that are less likely to trigger post‑prandial hunger. When integrated into a daily food diary, the glycemic‑index data can be cross‑checked against subjective hunger ratings, enabling feedback loops that refine long‑term eating habits. For those using calorie‑restricted plans, the table assists in balancing energy intake with glycemic impact, ensuring that calorie deficits do not compromise metabolic stability. Pairing low‑GI foods with protein or healthy fats further extends satiety and helps stabilize post‑meal glucose and maintain energy daily

How to Interpret GI Values in the Table
Interpret the glycemic index by comparing each food’s score to the reference value of 100, representing pure glucose. Low GI foods (<55) release glucose slowly, while medium (56‑69) and high (>cause rapid spikes. Use the PDF’s color codes to quickly spot suitable choices for steady energy.! !!!
Low, Medium, and High GI Foods
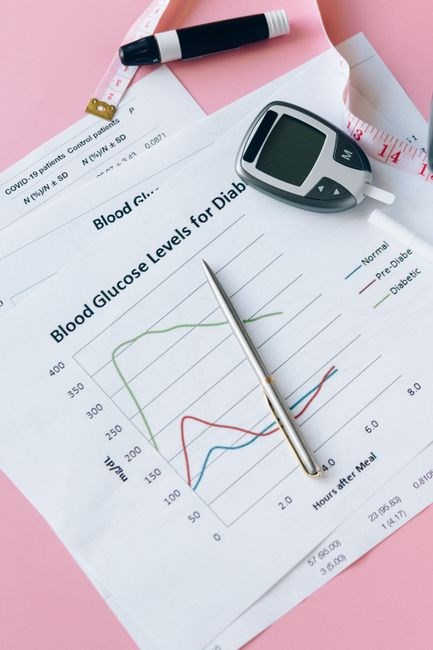
In a comprehensive glycemic‑index PDF, foods are grouped by their impact on post‑prandial glucose. Low‑GI items (≤55) such as lentils, whole‑grain breads, and most non‑starchy vegetables release glucose gradually. Medium‑GI foods (56‑69) like ripe bananas, baked potatoes, and whole‑grain cereals offer a moderate rise, useful when balanced with protein fat to blunt spikes. High‑GI foods (>70), including white bread, sugary drinks, and refined pastries, provoke rapid glucose surges, which can be problematic for insulin sensitivity and weight control. The PDF’s color‑coded rows—green for low, yellow for medium, red for high—allow quick visual assessment. When planning a meal, pairing a high‑GI carbohydrate with a low‑GI protein or fiber source can lower the overall glycemic load. For example, a slice of white bread with avocado or a protein‑rich side will shift the effective GI downward. The table also lists portion sizes, ensuring that the glycemic load calculation reflects realistic servings. By consulting the PDF, dietitians can tailor recommendations to individual metabolic goals, whether managing diabetes, optimizing athletic performance, or promoting weight loss. The clarity of the classification aids patients in making informed choices at the grocery store, in restaurants, and when crafting balanced diets that align with their health objectives.
The PDF also includes a glycemic load column, allowing users to calculate the actual impact of a typical serving. By comparing load values, one can prioritize foods that keep blood sugar within target ranges. This systematic approach empowers clinicians and patients to make evidence‑based dietary adjustments!
Combining Foods to Lower Overall GI
When using a complete glycemic‑index PDF, the most effective strategy for moderating post‑prandial glucose is to pair high‑GI foods with low‑GI or high‑fiber components. The table’s color‑coded rows help identify companions: a slice of white bread (GI ≈ 70) balanced by a tablespoon of chia seeds (GI ≈ 30) and leafy greens (GI ≈ 15). The resulting glycemic load drops by roughly 40 %, because fiber slows gastric emptying and protein from the seeds stimulates insulin release.

Another tactic is to mix a medium‑GI carbohydrate such as cooked quinoa (GI ≈ 53) with healthy fat, like sliced avocado (GI ≈ 15). The fat’s lipids form a barrier that delays carbohydrate absorption, flattening the glucose curve. The PDF’s “Effective GI” column confirms the combined meal scores a 45‑point GI—well below the original 53.
For snack planning, pair fruit with nuts. A medium‑sized apple (GI ≈ 38) with a handful of almonds (GI ≈ 15) yields a lower load, 25 % less than the apple alone. Nuts’ protein and fat stabilize blood sugar, ideal for pre‑exercise or post‑workout recovery.
The PDF’s “Meal Builder” lets users drag and drop items, instantly recalculating composite GI and glycemic load. Adding cinnamon to oatmeal can lower the cereal’s GI from 70 to 55, as polyphenols inhibit carbohydrate digestion. These pairing principles help maintain glucose stability and support long‑term health. Users can track progress with the PDF’s calculator. Adjust portions for personalized goals. Ensures balanced nutrition. Stay fit.

Finding and Downloading Reliable GI Table PDFs
Search the USDA database for PDF tables. Verify source credibility by checking author credentials and publication date. Use the PDF’s “Download” button, ensuring the file is PDF/A for preservation. Store the file in a secure folder. and link now.
Official Sources and Academic Publications
When seeking a comprehensive glycemic‑index table in PDF format, the most authoritative references come from government agencies, university research groups, and peer‑reviewed journals. The United States Department of Agriculture (USDA) publishes the FoodData Central database, which includes a downloadable PDF of the 2002 Glycemic Index database. This file lists 200 foods, their GI values, and serving sizes, and is updated annually to reflect new research.
Another key source is the International Table of Glycemic Index Values, released by the International Glycemic Index Foundation (IGIF). The IGIF PDF, available through their official website, compiles data from over 50 peer‑reviewed studies and provides a standardized reference for clinicians and dietitians worldwide.

Academic institutions such as the University of Sydney and the University of Toronto have published open‑access PDFs of their own GI datasets. These documents often include methodological details, such as the test meal composition, participant demographics, and statistical analysis, allowing users to assess the reliability of the values.
Peer‑reviewed journals—e.g., the American Journal of Clinical Nutrition and Diabetes Care—include PDFs with GI tables. Accessing these through libraries ensures the data is vetted!!
When downloading, verify the file format is PDF/A to guarantee preservation. Check author info and citation metrics to confirm authenticity. Finally, maintain a citation list for future reference!!
Third-Party Nutrition Websites and Mobile Apps
Numerous independent platforms provide downloadable GI tables in PDF format, often enriched with user‑friendly interfaces and cross‑referenced nutritional data. Popular sites such as MyFitnessPal, Cronometer, and Healthline host interactive GI charts that can be exported as PDFs, allowing users to customize serving sizes and track macronutrients simultaneously. Mobile apps like MyPlate, Yazio, and Carb Manager offer built‑in GI calculators; many include a “save as PDF” option for offline reference. These resources typically aggregate data from the USDA database and peer‑reviewed literature, ensuring consistency across platforms. Users should verify that the PDF includes a clear legend, reference foods, and the methodology used for GI determination. Some apps, such as the “Glycemic Index” app by the International Glycemic Index Foundation, provide a curated PDF that updates quarterly to reflect new research findings. When downloading from third‑party sites, always check for the latest version number and publication date to avoid outdated values. Additionally, many of these platforms provide API access for developers, enabling integration of GI data into custom meal‑planning tools. By leveraging these third‑party resources, dietitians and patients can maintain an up‑to‑date, easily accessible glycemic index reference without the need for specialized software. Moreover, the community forums on these sites often feature user‑generated lists of low‑GI foods, which can be cross‑checked against the official tables for personal preference. The ability to annotate PDFs directly within the app, using highlight or note tools, helps clinicians document patient progress and tailor dietary recommendations. Finally, many third‑party services offer bilingual PDFs, catering to non‑English speakers and ensuring broader accessibility. They enable precise choices daily!